KBRA Financial Intelligence
KFI: Bank and Credit Union Data Platform for Peer Benchmarking & Counterparty Risk
By KFI Staff
KBRA Financial Intelligence (KFI), a division of KBRA Analytics, is a bank and credit union data platform that combines our proprietary KFI Scores with comprehensive financial data for peer benchmarking analysis and counterparty risk management.
KFI Platform
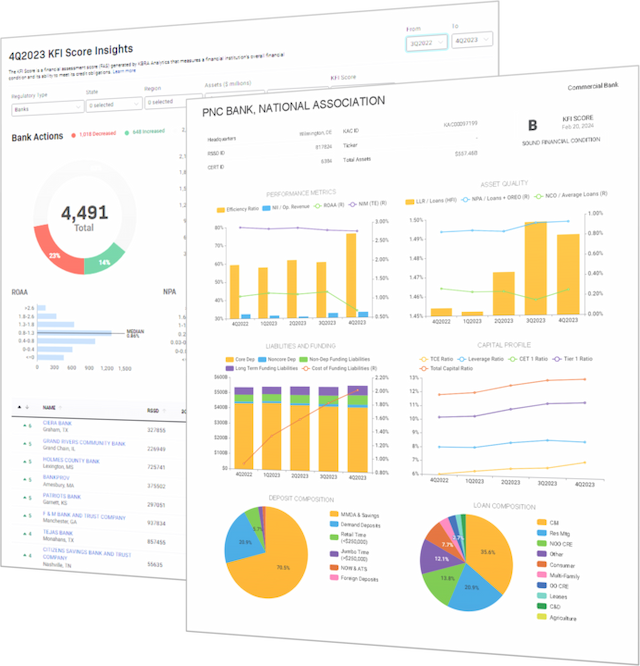
The KFI web application offers overview pages for quick analyses on all U.S. banks and credit unions - totaling nearly 10,000 institutions.
Search for institutions by name, ticker, or regulatory identifiers (including the RSSD ID, FDIC CERT, or NCUA Charter ID) to view the institution's financial metrics, corporate structure, financial filings, scores and ratings, branch map, and Community Reinvestment Act (CRA) ratings and enforcement actions.
Data Universe & Delivery Channels

KFI Scores
KFI Scores are proprietary quarterly financial assessment scores that measure the financial health of all U.S. banks and credit unions on an A through E scale using FFIEC and NCUA Call Report data. Our models incorporate various asset quality, capital adequacy, earnings performance, and liquidity and funding measures for managing counterparty risk and robust peer analysis.
From 2010 through 2024, 96% of banks that failed had a KFI Score of D or lower prior to the FDIC date of failure, according to KFI data.
Who Uses KFI?
A diverse array of clients trust KFI for their financial data needs, including banks, credit unions, government agencies, and insurance companies, among others.

KFI Functionality
Peer Benchmarking
Create peer groups using quantitative and qualitative fields, such as asset size and region, with KFI's powerful Excel add-in Data Wizard. With just a few clicks, users can quickly answer the following questions:
What credit unions in the South have a return on average equity (ROAE) above 10%?
What did Cenlar FSB report for net interest margin (NIM) in the last four quarters?
How much outstanding debt do credit unions currently hold?

Tear Sheets
Utilize the Snapshot Report as a two-page overview of critical performance metrics across various categories to quickly assess the financial condition of an institution. Easily generate a PDF for quick sharing across team members.

Bespoke Analysis with Excel Add-in
KFI Pro subscribers have full access to our template library, a repository of Excel analyses that are fully customizable and can be refreshed each quarter for the latest data using the KFI Excel add-in. For example, track delinquencies across more than a dozen loan categories to identify deteriorating credit quality at individual lenders.

Dynamic Dashboards
KFI Pro subscribers can access newly developed dashboards with new datasets, including enforcement actions, CRA ratings, and deposit and branch mapping tools powered by Summary of Deposits (SOD) data.
Enforcement actions filed against banks, BHCs, and credit unions by the FDIC, OCC, FRB and the NCUA can be filtered with various categories including issued date, CMP amount, and individual institution.

Deposit and branch mapping tools can be used to identify the precise footprint of multiple financial institutions within a specified geographic area, which can be defined as broadly as a group of states or as granular as a single zip code.

Audit Functionality
Users can see exactly how KFI calculations are defined, providing greater transparency. Simply click on the line item on the web application to identify the underlying mnemonic, description, and formula.

Macroeconomic & Demographic Data
Our integration of macroeconomic indicators enables users to seamlessly reference and download the latest releases and time series collected by an array of government agencies, as well as the Federal Reserve. Hundreds of data points covering GDP, employment, inflation, rates, housing, auto sales, construction spending, and more will allow users to identify shifting trends in the economy and examine their impact on bank-level data within the KFI platform.

U.S. Census data is also live on KFI. Variables including age, income, diversity, commute, education, and more will optimize your understanding of the demographic trends shaping the communities you serve. Whether you’re looking to assess community lending opportunities, enhance regulatory reporting, or develop a growth strategy for your institution, these new capabilities provide unique insights into hundreds of metropolitan statistical areas (MSA) across the U.S.

